Measuring What Matters: Benchmarking Key Journeys and Establishing a System Usability Score
Theme: “Benchmarking Experience Quality”
Focus: Measurement • Quantitative Research • Product Analytics
CONTEXT & CHALLENGE
As our platform expanded, teams lacked a unified way to measure and compare usability across key user journeys.
Qualitative research surfaced issues, but we had no consistent, quantifiable metric to track experience quality over time or link UX to product performance.
How might we establish a repeatable framework to benchmark usability, quantify experience health, and connect UX metrics with product analytics?
MY ROLE
As Senior UX Research Manager, I led a mixed-methods initiative with two UX researchers, a product analyst, and a design lead.
We collaborated with PMs and Data Science to benchmark key journeys, establish a System Usability Scale (SUS) baseline, and connect findings to behavioral metrics.
Stakeholders included: Product Strategy, Analytics, and Design Leadership.
APPROACH
I designed a journey benchmarking program that integrated qualitative usability testing with quantitative analytics to create an ongoing measure of UX health.
Journey Identification
- Partnered with Product and Design to define top five critical user journeys across the platform (e.g., account setup, API integration, task completion).
- Mapped expected vs. actual user flows using analytics data.
Benchmark Research Design
- Conducted moderated usability tests to capture performance, satisfaction, and task success.
- Applied the System Usability Scale (SUS) for standardized scoring.
- Gathered attitudinal and behavioral data across new and existing users.
Data Integration & Analysis
- Correlated SUS results with product metrics (completion rate, error rate, time-on-task).
- Identified experience drivers most predictive of churn and satisfaction.
Framework & Governance
- Developed a reusable benchmarking toolkit for ongoing measurement.
IMPACT
Quantitative Results:
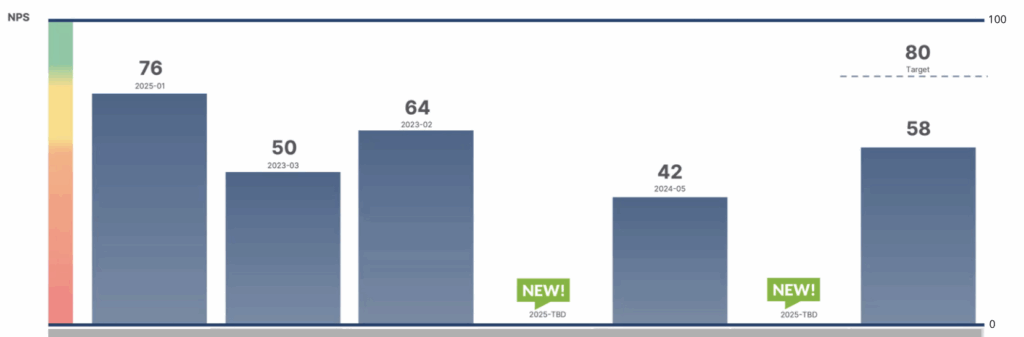
- Established a industry target score of 80 across key flows, identifying multiple journeys below industry benchmarks.
- Delivered 12 prioritized UX recommendations, leading to measurable improvements (+9 SUS points average in next release).
- Linked improvements to task completion rate and reduced support tickets.
Qualitative Results:
- Provided leadership with a quantifiable UX health metric for the first time.
- Enabled data-informed prioritization of usability investments.
- Created a shared, repeatable framework adopted by multiple product teams.
LESSONS LEARNED
This initiative established a data-driven foundation for UX quality measurement, bridging research and analytics to drive accountability and progress tracking.
By introducing a quantifiable usability benchmark, I helped the organization move from subjective feedback toward evidence-based UX decisions.
I learned that combining standardized metrics like SUS with behavioral analytics creates not just a measurement tool, but a strategic signal for where to invest in design improvements.
ARTIFACTS
UX Benchmark Dashboard: visualizing SUS scores and key metrics per journey.
Journey Map Snapshot: overlaying qualitative and quantitative findings.
Slide Example: “UX Health Baseline and Improvement Roadmap.”
Toolkit Template: repeatable study design and analytics integration guide.